When you log in to your Chainlink Marketing Platform account for the first time, you will be presented with a quick tour explaining the platform and some of its key features. If you ever get stuck on a page within the platform, there is a help button in the bottom right corner that you can expand to provide tips and explanations for every page and feature. You can always revisit the introductory tour by expanding the help section on any page and clicking the “Launch the Tour” link in the purple box.
When you exit the introductory tour, you will be brought to the Marketing Dashboard. The dashboard gives you an overview of all of your marketing programs and capabilities within Chainlink’s Marketing Platform, as well as previewing many of your important marketing analytics. You’ll find a high-level breakdown of your marketing performance, target activity, email scheduling and performance, and some quick links to easily navigate Chainlink’s Marketing Platform.
Note: If you are the main account user, you will be able to set up your Default Settings from the dashboard (Default Settings button next to “Add Widget” and “Edit Layout”).
For more information on setting up your Account Default Settings, take a look at our Default Account Settings Setup Knowledge Base.
1. Quick Start Links
At the top of the dashboard, you’ll find a few quick links that make it easy to navigate to different parts of the platform without having to spend any time searching. Here you will find links to:
- Programs
- Live Scores
- Create a New Program
- Create a New Web Form
- Find a Target
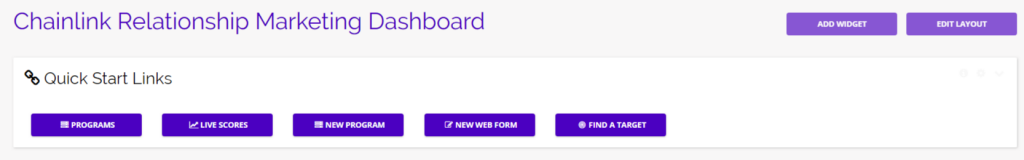
- Note: The Add Widget and Edit Layout features are coming soon!
2. Marketing Performance
Under your quick start links, you’ll see your high-level marketing statistics, which shows the following:
- Total Active Targets
- Total Messages Sent
- Email Delivery Rate
- Total Bounces
- Email Open Rate
- Total Engagement
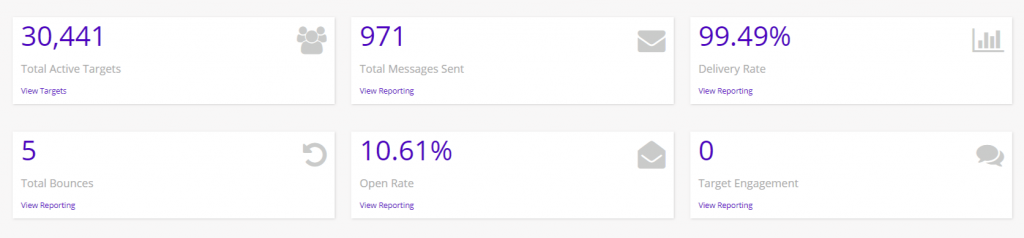
You can click on any of the View Reporting links under each stat for a quick way to redirect to the specific reporting page, expanding on the statistics you see on the dashboard.
3. Targets
Next, you’ll see some details on your Targets. Targets are the end recipients and contacts that are the “marketing targets” of every single marketing effort. This section of the dashboard shows a breakdown of your Target activity as well as an interactive map showing where your Targets are interacting from.
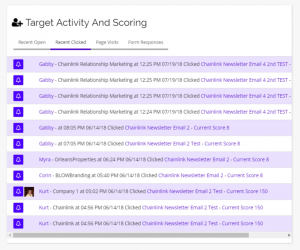
Target Activity And Scoring:
- Target Activity And Scoring shows who has recently opened any emails sent through the platform, recent clicks, page visits, and form responses.
- You can also see a Target’s current score based on their activity.
- Take a look at our Target Score Settings Knowledge Base for an in-depth look at how the scoring system works in Chainlink’s Marketing Platform.
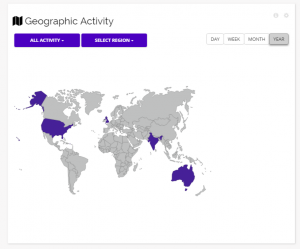
Geographic Activity:
- Next to your Target Activity And Scoring information, you will find your Geographic Activity Map. This is a cool feature that you can use to visualize where in the world your target audience is engaging from.
- You are able to filter the Activity Map by:
- Action: Opens/Clicks
- Region: World/USA
- Time: Day/Week/Month/Year
4. Email
Next, you’ll find your Email Marketing information: The Marketing Calendar and Recently Deployed Email Messages.
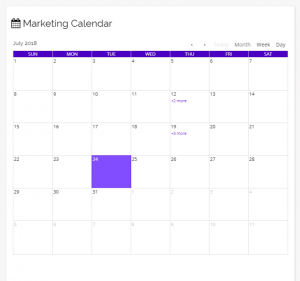
Marketing Calendar:
- Your Marketing Calendar is a simple tool where you can see all of your planned programs for the month. You can also add an existing program to the calendar right from the Marketing Dashboard.
- To add a program to the calendar, simply click on the day you want to add the program to and enter the program name.
- The Marketing Calendar can be filtered by Month, Week, or Day.
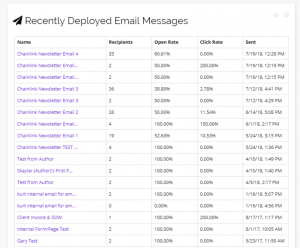
Recently Deployed Email Messages:
- Recently Deployed Email Messages shows a quick overview of all of your recently sent Email Programs, giving you insight into how many people received the message, what the open and click through rates are, and when exactly the message was sent.
- To view a specific Email message, click on the highlighted name of the desired Email and you will be brought to a detailed page with all of the information and stats based on that email program.
5. Additional Information
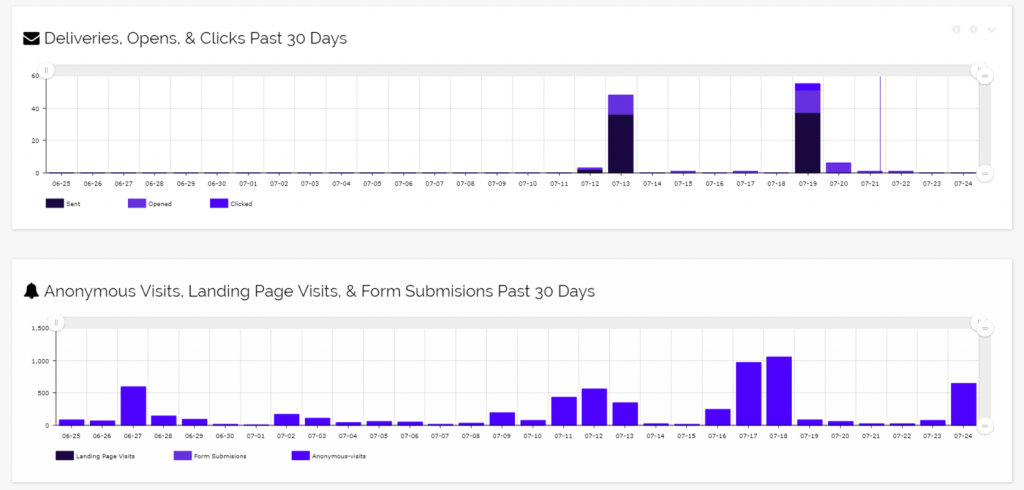
Below your email marketing information, you will find a couple of graphs that can be used to analyze the daily performance of your Marketing Programs.
- The standard dashboard layout has two graphs:
- Deliveries, Opens, and Clicks in the Past 30 Days
- Anonymous Visits, Landing Page Visits, and Form Submissions in the Past 30 Days
6. Customizing Your Dashboard
- Coming Soon!