Chainlink’s Marketing Analytics helps you optimize your marketing efforts for maximum effectiveness, as well as uncover long-term trends to spot consistent winning strategies. The Analytics Overview is made up of a series of graphs that give you an idea of how well certain marketing efforts are performing. Uncover which emails, links, landing pages, forms, devices and more are producing the best results.
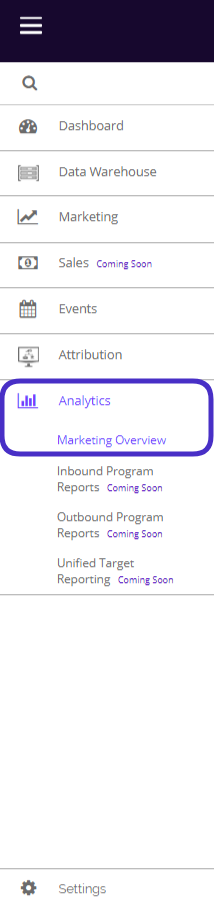
To access marketing analytics, navigate to Analytics > Marketing Overview.
This is what the Marketing Analytics Overview page looks like:
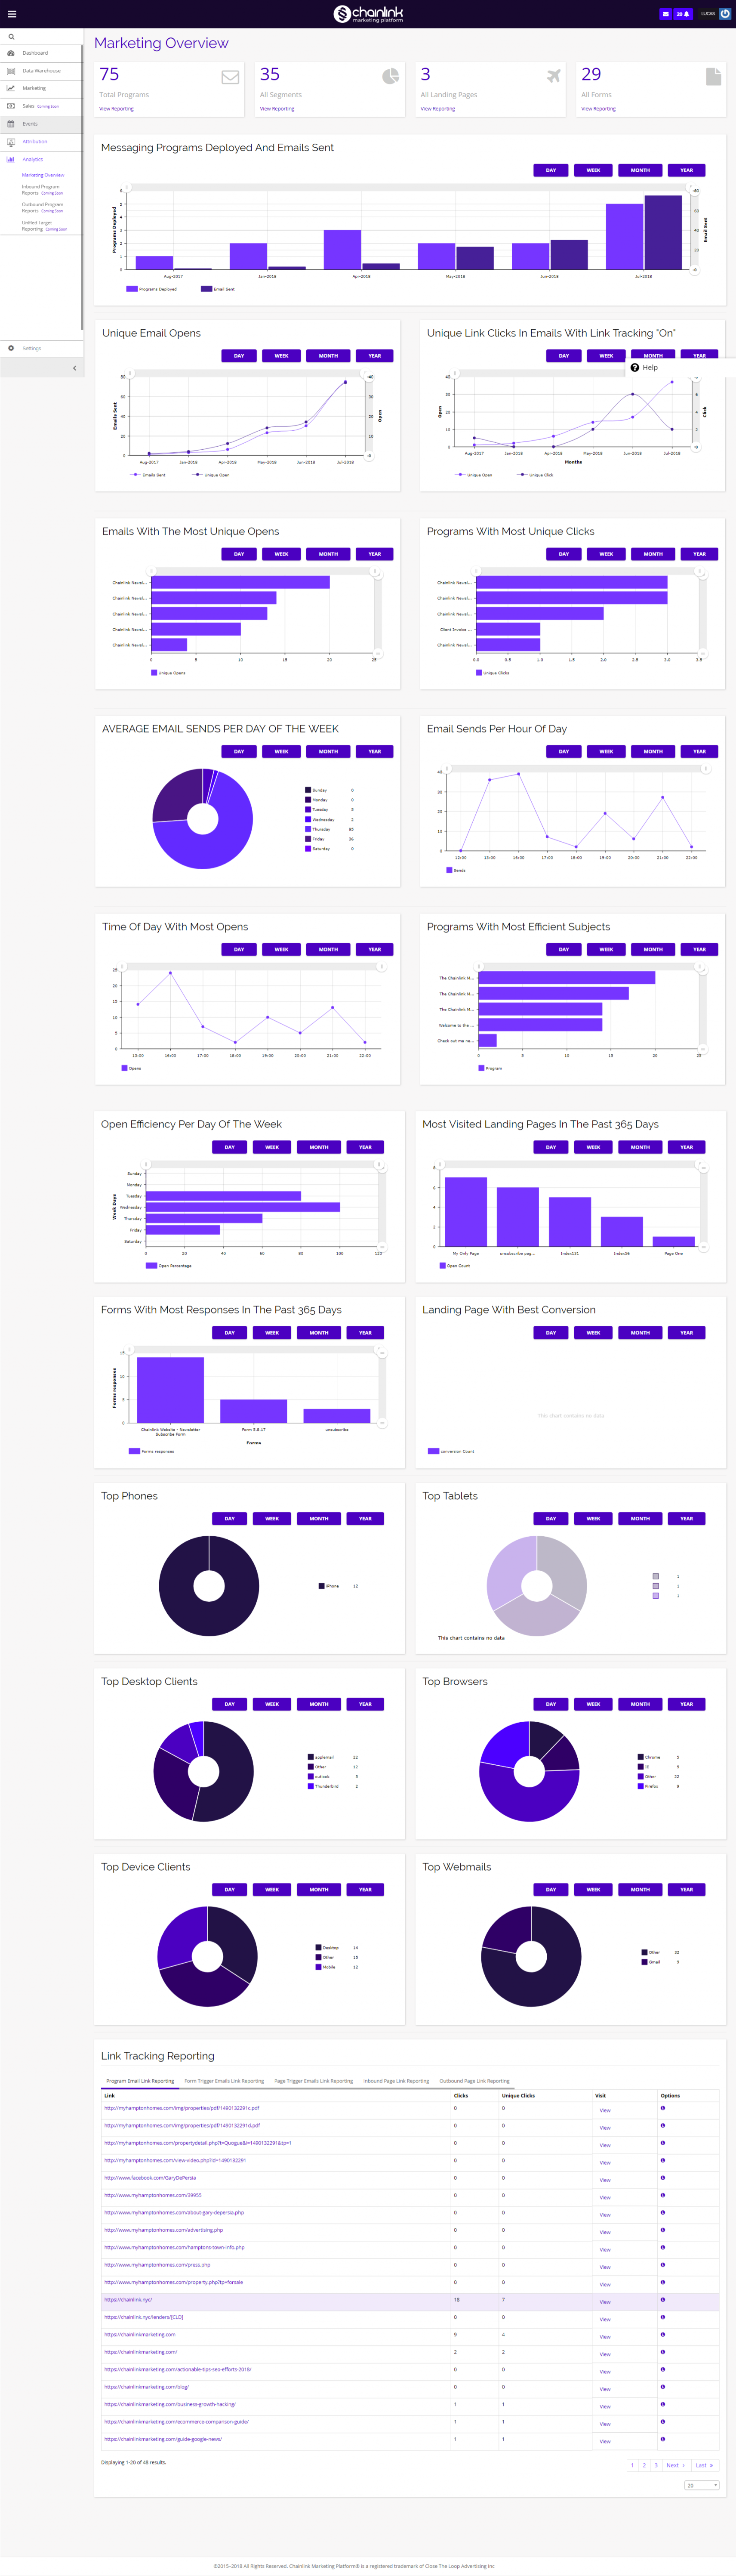
From the Marketing Analytics Overview page you get access to a number of different graphs and reports that can help you uncover trends in your marketing efforts.
You will find basic information like total programs, segments, landing pages, and forms, as well as more in-depth statistics like unique email opens, link clicks, average emails sent, most efficient programs, most visited landing pages, most efficient time/day to send emails, top devices used, and much more.
- You can filter all of the graphs by day, week, month, or year by using the purple buttons above each graph.
- You can also edit the graph sizes using the circle sliders on the horizontal and vertical axes if you want to focus in on one part of the data.
- Below we will get into more detail about what each graph measures.
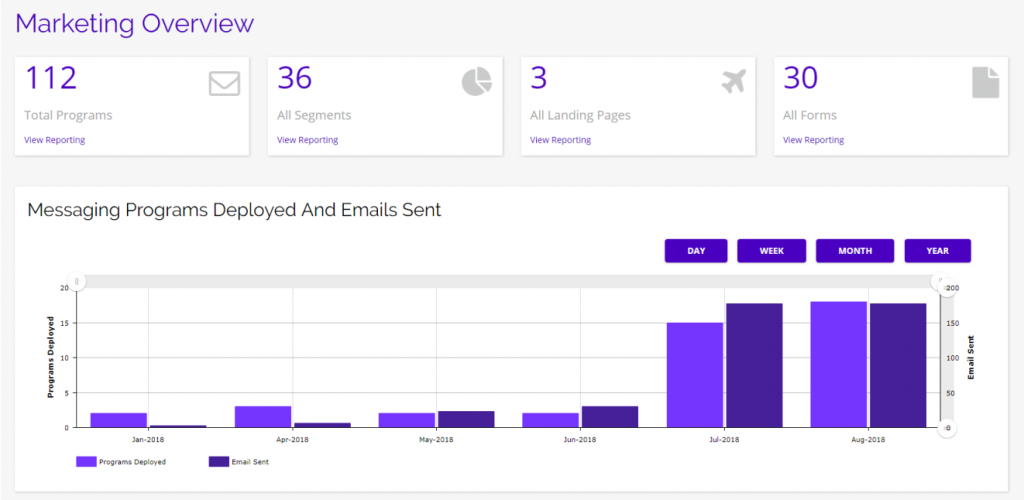
- The highest level data is your total programs, total segments, total landing pages, and total forms.
- Below these high level stats, there is a graph showing total messaging programs deployed and emails sent.
- Click on the View Reporting link under any of the stats to quickly navigate to that part of the platform.
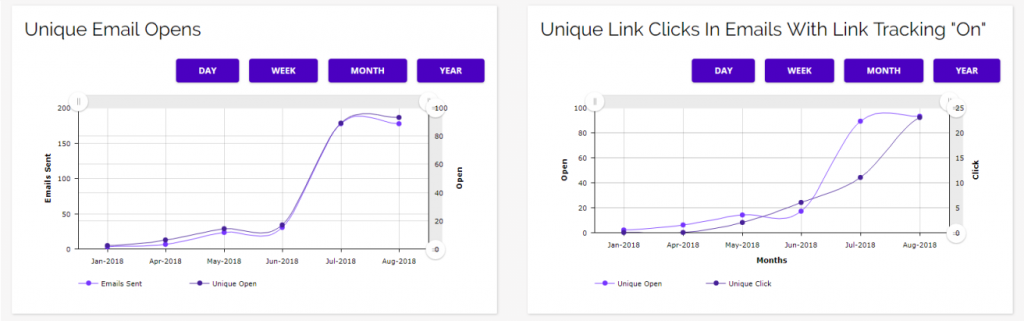
- Next, you will find Unique Email Opens and Unique Link Clicks.
- These are important stats because they show you overall how many opens and link clicks (engagement) you generate from your email programs, not counting people who open an email or click a link twice from the same account across all of your marketing efforts.
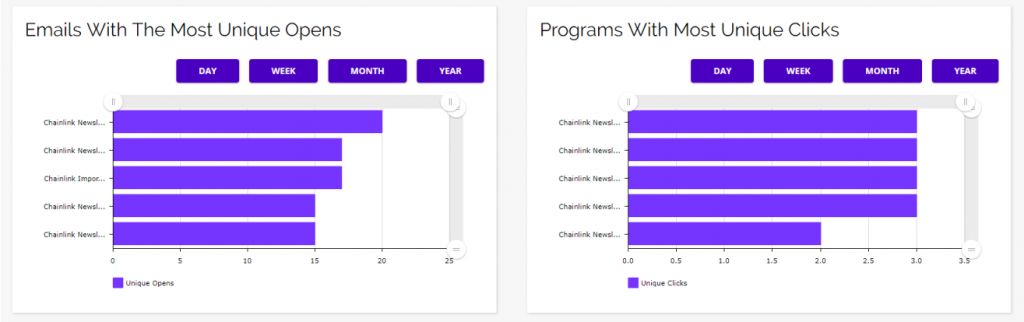
- The next two graphs are also based on Unique Email Opens and Link Clicks, but these break down the stats into individual emails and programs.
- These graphs can be used to easily measure which of your emails and programs are performing the best.
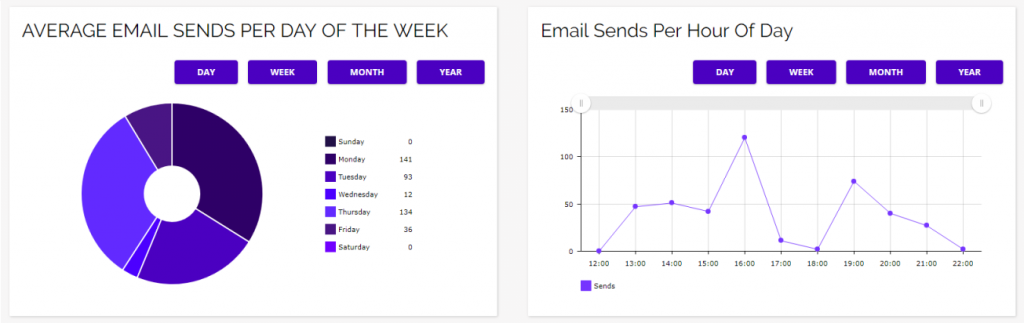
- The next pair of graphs go into more detail about email sends, showing your Average Email Sends Per Day of the Week and Email Sends Per Hour of Day.
- These graphs will give you an idea of when you and your team are most active in the platform.
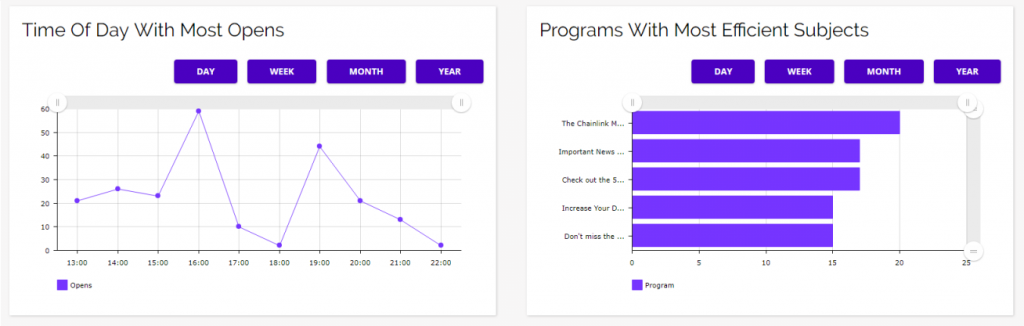
- The next graphs show the time of day with the most email opens and your programs with the most efficient subject lines.
- Paired with the previous set of graphs, you can easily figure out when the most efficient time is to send your outbound programs.
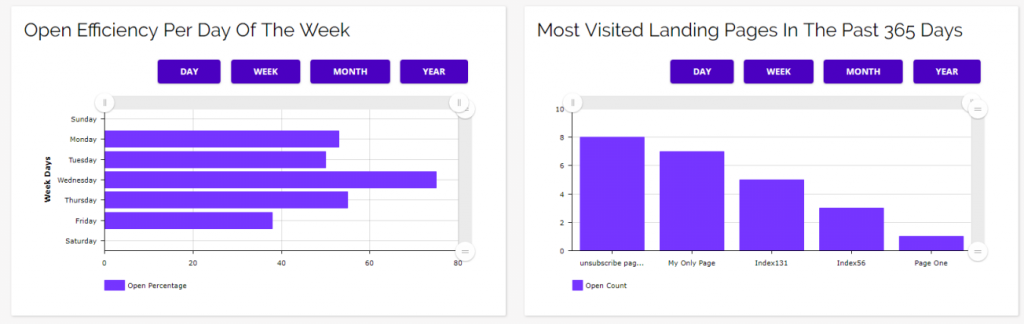
- The next two graphs show you the percent of emails opened per day of the week and what your most visited landing pages are.
- These can be useful for finding the best day to send out emails and which landing pages have been the most successful across campaigns.
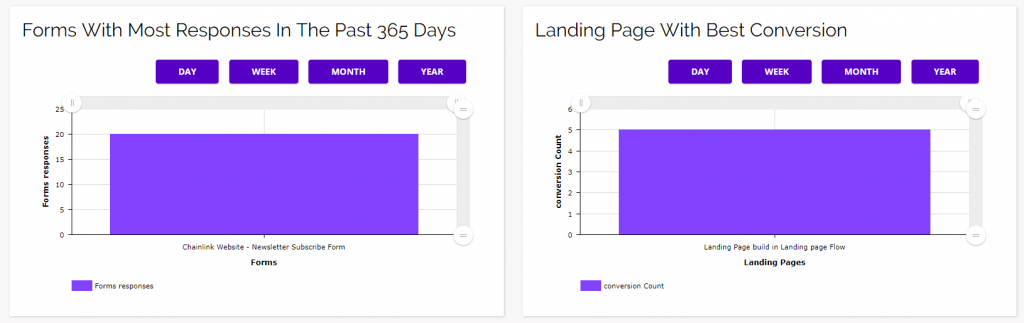
- These graphs show which of your forms are generating the most responses and which of your landing pages have the best conversion rate.
- Analyzing your form responses and landing page conversions can help you figure out what form/page designs and methods are the most effective.
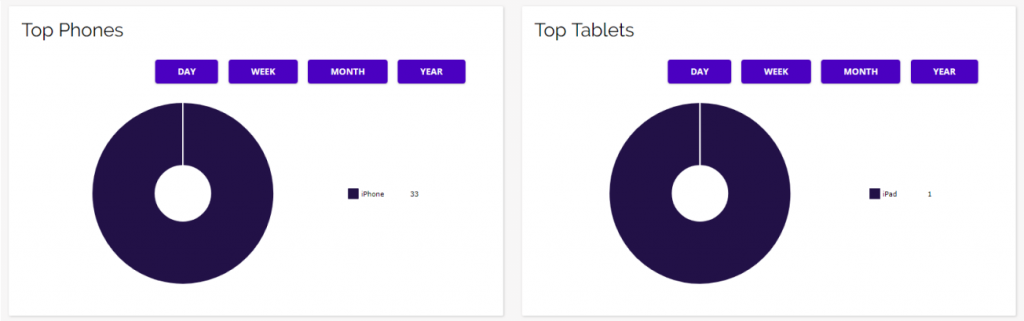
- The next set of graphs show you what the top phones and tablets are being used when interacting with your marketing programs.
- These stats can be useful to figure out which devices you should be optimizing your emails and landing pages for, even though you should be optimizing for all devices.
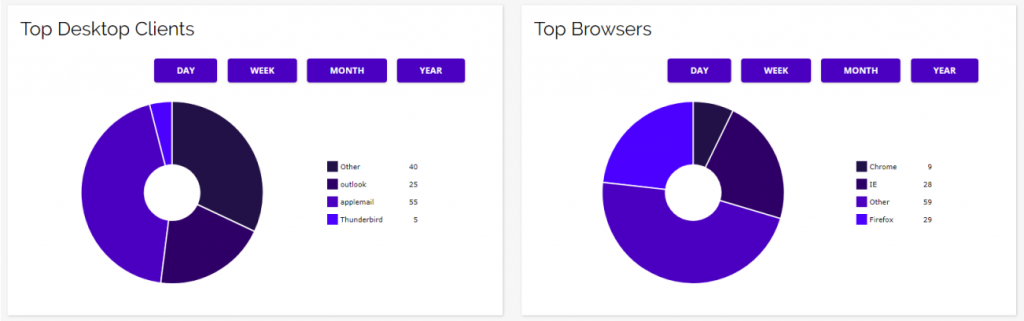
- These two graphs show your top desktop clients and top web browsers.
- Again, this data can be useful for determining what desktop clients and web browsers you should be optimizing your programs for, even though you should be optimizing and testing your programs across all clients and browsers.
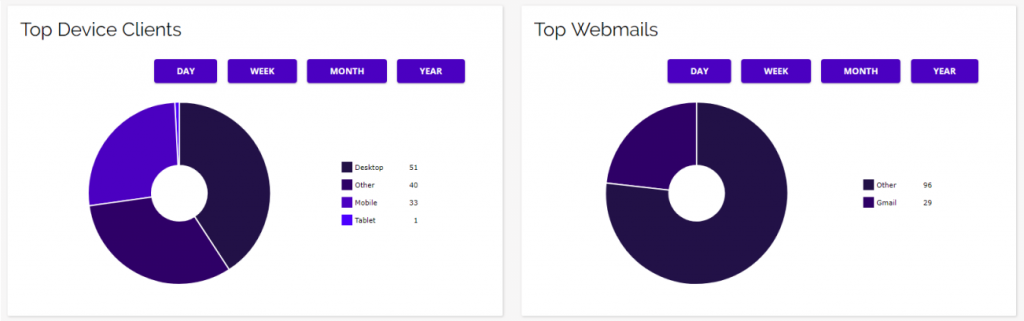
- The two final graphs show you the top device types and top web mail providers your targets are using when interacting with your programs.
- These graphs are also helpful for determining which devices and web mail providers your programs should be optimizing for.
![]()
- The last section of the Marketing Analytics Overview is your Link Tracking Reporting.
- Here you can see the results of all of the links that you are currently tracking in terms of clicks and unique clicks.
- You can visit a link you are tracking by clicking directly on the URL, or clicking the purple view link under the visit column.
- For a more detailed click report, click the “i” icon under the options column for the URL you want to analyze.
- You can navigate your different link tracking reports by clicking on the report type you want to view in the toolbar at the top of the report. You can choose from:
- Program Email Link Reporting
- Form Trigger Emails Link Reporting
- Page Trigger Emails Link Reporting
- Inbound Page Link Reporting
- Outbound Page Link Reporting